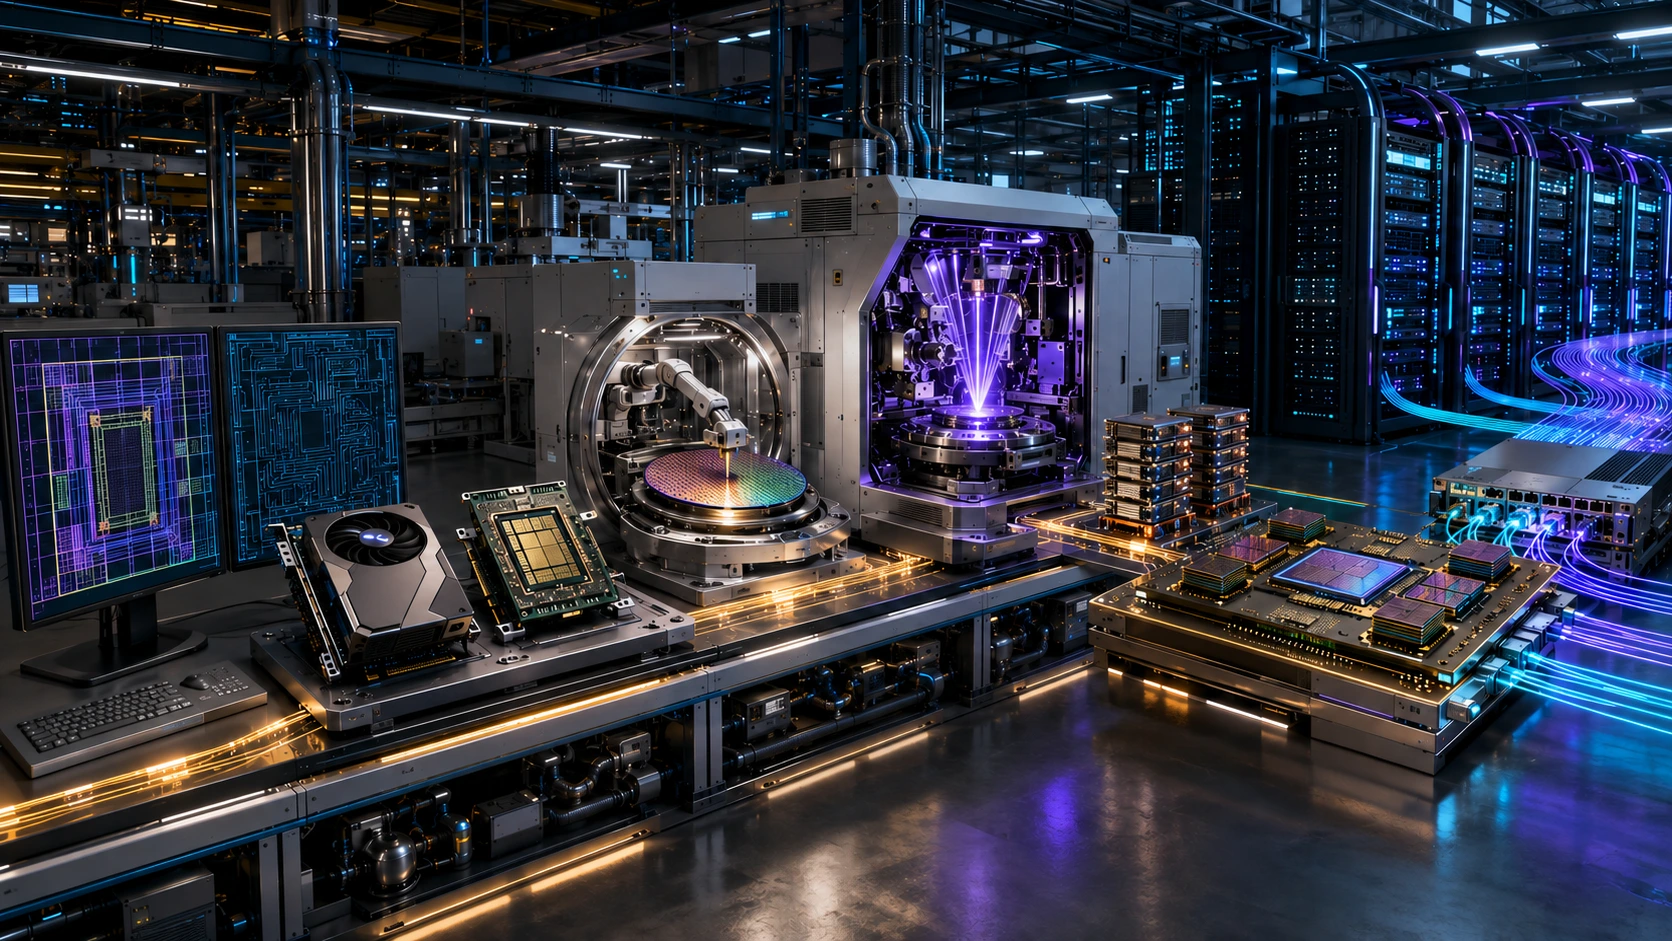
The AI chip stack is much broader than the GPU at the center of an AI server. Before an accelerator can train or run a model, it must be designed with specialized software, manufactured on an advanced process, paired with high-bandwidth memory, assembled through complex packaging, and connected to thousands of other processors across a data-center network.
That chain creates several different ways for investors to gain exposure to artificial-intelligence infrastructure. It also creates a common analytical mistake: treating every semiconductor company as if it sells the same product, faces the same cycle, or should be valued with the same metric.
Nvidia (NASDAQ: NVDA) and AMD (NASDAQ: AMD) sell computing platforms. Taiwan Semiconductor Manufacturing Company (NYSE: TSM) manufactures many advanced chips designed by other companies. Micron Technology (NASDAQ: MU) supplies memory. Broadcom (NASDAQ: AVGO) participates in custom accelerators and networking, while Arista Networks (NYSE: ANET) sells network platforms that connect large clusters.
They can all benefit from AI spending, but the source, durability, and risk of that revenue are different.
The AI Chip Stack in One Table
| Layer | What it contributes | How suppliers generally make money | Metrics investors should follow | Selected U.S.-listed stocks and ADRs |
|---|---|---|---|---|
| Design software and IP | Tools and reusable intellectual property used to design and verify chips | Software subscriptions, licenses, maintenance, and IP royalties | Backlog or remaining performance obligations, renewal activity, operating margin, R&D intensity | Synopsys (SNPS), Cadence (CDNS), Arm (ARM) |
| Accelerators and custom silicon | GPUs, AI accelerators, CPUs and application-specific chips | Chip, board, system and platform sales; in some cases software and support | Data-center revenue, gross margin, product cadence, customer concentration, supply commitments | Nvidia (NVDA), AMD (AMD), Broadcom (AVGO), Marvell (MRVL) |
| Foundries | Convert chip designs into silicon wafers | Wafer-manufacturing and related service revenue | Leading-node mix, utilization, yield, gross margin, capital expenditure | TSMC (TSM), Intel (INTC), GlobalFoundries (GFS) |
| Manufacturing equipment | Lithography, deposition, etch, process control and inspection tools | System sales plus service and installed-base revenue | Bookings, backlog, tool shipments, service mix, customer capex | ASML (ASML), Applied Materials (AMAT), Lam Research (LRCX), KLA (KLAC) |
| Memory | HBM, DRAM and NAND that feed data to processors and store data | Memory and storage product sales | Average selling prices, bit shipments, HBM mix, inventory, capex and yields | Micron (MU) |
| Advanced packaging and test | Combines logic and memory dies, then tests finished packages | Packaging, assembly and testing services | Advanced-packaging capacity, utilization, customer mix and capital intensity | Amkor (AMKR), TSMC (TSM) |
| Networking and interconnect | Moves data among accelerators, servers and storage | Switch, adapter, interconnect, optics and custom-silicon sales | Networking revenue, port speed, system bandwidth, margins, and customer concentration | Nvidia (NVDA), Broadcom (AVGO), Arista (ANET), Marvell (MRVL) |
The stocks above illustrate where publicly traded companies fit in the value chain. The table is not a buy list or a claim that every company has equal AI exposure.
A Current AI Exposure Snapshot—Without Calling It Market Share
The latest company disclosures show why definitions matter. The following figures are exposure indicators, not a direct revenue, valuation, or market-share comparison. Each company uses its own fiscal calendar and segment definitions.
| Company and latest reported period available on August 26, 2026 | Disclosed measure | ABBO News calculation or reported share | What the figure does—and does not—show |
| Nvidia, Q2 fiscal 2027, ended July 26, 2026 | $89.023 billion of Data Center revenue on $96.221 billion of total revenue | Approximately 92.5% | Shows Nvidia’s concentration in Data Center under its reporting framework. It includes accelerators, networking, systems, software, and services—not only standalone GPU sales. |
| AMD, Q2 2026 | $6.7 billion of Data Center revenue on $11.536 billion of total revenue | Approximately 58.1% | Includes EPYC server CPUs and Instinct GPUs; it is not a pure AI-accelerator figure. |
| Broadcom, Q2 fiscal 2026, ended May 3, 2026 | $10.8 billion of management-identified AI semiconductor revenue on $22.187 billion of total revenue | Approximately 48.7% of total revenue and 72.0% of semiconductor-solutions revenue | Captures custom AI accelerators and AI networking identified by management. It should not be compared directly with another company’s broader Data Center segment. |
| TSMC, Q2 2026 | High-performance computing represented 66% of quarterly revenue | 66%, company reported | HPC includes AI accelerators, processors, and other high-performance products; it is not an AI-only revenue share. |
| Micron, Q3 fiscal 2026, ended May 28, 2026 | Data Center revenue exceeded $25.0 billion on $41.456 billion of total revenue | Over 60.3% | Shows exposure to cloud and data-center memory and storage. It does not isolate HBM or AI-only revenue. |
Layer 1: Design Software and IP Start the Process
Every advanced processor begins as a design. Electronic design automation software helps engineers create, simulate, verify, and prepare that design for manufacturing. Reusable intellectual property can shorten development time by supplying prebuilt processor architectures, interfaces, and other components.
Synopsys (NASDAQ: SNPS) and Cadence Design Systems (NASDAQ: CDNS) are major EDA providers, while Arm Holdings (NASDAQ: ARM) primarily monetizes processor IP through licensing and royalties.
This layer usually has less direct exposure to the number of chips shipped in a single quarter than a memory producer or foundry. Its economics depend more on design activity, contract duration, renewal rates, and the number and value of new chip programs.
Cadence’s Q2 2026 results illustrate the model’s visibility: the company reported $8.1 billion of quarter-end backlog and $4.2 billion of remaining performance obligations expected to be recognized over the following 12 months. Those figures are not equivalent to cash or quarterly revenue, but they help investors assess contracted demand.
The key risk is that strong chip demand does not automatically produce equal growth for every design-tool vendor. Contract timing, customer consolidation, product mix, and R&D spending can materially affect results.
Layer 2: GPUs and Custom Accelerators Capture the Most Visible Spending
Accelerator designers receive most of the attention because their chips perform the calculations behind AI training and inference. Yet even within this layer, business models differ.
AI cloud operators form the next commercial layer by turning those systems into rentable computing capacity; CoreWeave’s Q2 results show both the demand upside and the financing cost of that model.
Nvidia sells an increasingly integrated platform spanning accelerators, networking, systems, and software. In fiscal Q1 2027, Nvidia reported $60.4 billion of Data Center compute revenue and $14.8 billion of Data Center networking revenue. Networking therefore represented approximately 19.7% of Nvidia’s Data Center revenue under the company’s previous submarket presentation—evidence that its economics extend beyond the GPU itself.
AMD’s Data Center segment combines EPYC CPUs and Instinct accelerators. Broadcom’s AI semiconductor disclosure combines custom accelerators and AI networking. A dollar of reported revenue from one of these categories is therefore not identical to a dollar in another company’s segment.
Product performance still matters, but investors should also track software adoption, system-level capability, supply commitments, gross margin, and customer concentration. Export restrictions are another material variable. Nvidia’s Q2 fiscal 2027 outlook explicitly assumed no Data Center compute revenue from China, while ABBO News has separately covered the uncertainty surrounding reported Chinese approval for Nvidia H200 purchases.
Layer 3: Foundries Turn Designs Into Physical Chips
Fabless designers rely on external manufacturers to convert chip layouts into finished wafers. AMD’s 2025 Form 10-K, for example, says it uses third-party foundries for all its products and relies on TSMC for microprocessor and GPU wafers produced at 7 nanometers or smaller.
TSMC’s latest results show the strength of current demand for advanced computing. High-performance computing accounted for 66% of Q2 2026 revenue, while 7-nanometer and more advanced technologies generated 77% of wafer revenue. Those two percentages measure different things—platform mix and process-node mix—and should not be added together.
ABBO News examined TSMC’s record Q2 results, advanced-node mix and raised 2026 outlook. A separate analysis explains why TSMC sits at the center of advanced AI manufacturing.
For foundry investors, revenue growth is only part of the analysis. Yield, utilization, customer prepayments, node transitions, depreciation and capital spending determine how effectively demand becomes profit and cash flow.
Intel is different because it combines its own processor business with an effort to manufacture chips for outside customers. That makes a simple TSMC-versus-Intel revenue comparison misleading. Investors should separate Intel’s product economics from the utilization, customer wins, and capital requirements of its foundry operations. ABBO News has reviewed Intel’s supply constraints and foundry outlook.
Layer 4: Equipment Makers Sell the Tools That Create Capacity
Foundries and memory manufacturers cannot add advanced capacity without specialized equipment. ASML supplies lithography systems; Applied Materials and Lam Research participate in deposition and etch; KLA provides process control and inspection tools.
The equipment layer can benefit before a new fabrication line produces meaningful wafer revenue, because tools must be ordered, installed, and qualified first. The reverse is also true: if customers reduce or delay capital spending, equipment orders can weaken before end-market chip demand visibly falls.
ASML Holding (NASDAQ: ASML) is especially important at the leading edge. The company describes its EUV technology as unique to ASML and says EUV systems print the most intricate layers used in advanced logic and memory production.
ASML reported Q2 2026 net sales of €9.326 billion, including €2.762 billion of installed-base management sales. That service and field-option category represented approximately 29.6% of quarterly sales, according to an ABBO News calculation. It shows why equipment economics are not limited to new-tool shipments.
Investors should follow bookings, backlog quality, shipment timing, installed-base sales, and customers’ capital budgets rather than relying on a single quarter’s revenue alone.
Layer 5: HBM and Memory Feed the Accelerators
AI accelerators need rapid access to enormous quantities of data. High-bandwidth memory addresses that requirement by stacking memory dies close to the processor and moving data at much higher bandwidth than conventional memory configurations.
HBM can therefore become a system bottleneck even when accelerator supply improves. Capacity depends on DRAM wafer output, yields, advanced packaging and customer qualification—not simply on demand.
Micron’s fiscal Q3 2026 release said HBM3E was in high-volume shipments
Micron’s fiscal Q3 2026 release said HBM4 was in high-volume shipments for a lead customer’s platform and that samples had been sent to multiple end customers. Its fiscal Q3 2026 Form 10-Q also explains an important supply tradeoff: HBM requires more wafers and cleanroom space per bit than conventional DRAM.
That constraint can support pricing during tight conditions, but it creates cyclical risk. If HBM demand slows and suppliers redirect capacity toward conventional DRAM, broader memory supply can increase and pressure prices.
This is why Micron should not be analyzed like a GPU designer. Investors should monitor average selling prices, bit shipments, HBM mix, inventory, capital expenditure, and free cash flow across the cycle. ABBO News has also compared the roles of Broadcom, Micron and AMD in the data-center buildout.
Memory economics extends beyond HBM. SanDisk’s latest results show how NAND pricing, enterprise storage demand, and customer contracts can reshape revenue, margins, and cash flow.
Layer 6: Advanced Packaging Connects Logic and Memory
Manufacturing a leading-edge logic die is not the end of the process. The accelerator, HBM stacks, and interconnect components must be assembled into a package that can deliver adequate bandwidth, power, and thermal performance.
That has moved advanced packaging from a background manufacturing step to a potential capacity constraint. A company can have enough logic wafers and still be unable to ship complete systems if packaging capacity, substrates, testing, or HBM supply is limited.
TSMC participates in this layer through advanced-packaging services. Amkor Technology (NASDAQ: AMKR) provides outsourced assembly and test. Amkor’s 2025 Form 10-K describes technologies including 2.5D integration, high-density fan-out, advanced flip-chip and system-in-package solutions for high-performance computing and AI.
The layer’s most useful metrics are advanced-packaging revenue or capacity where disclosed, utilization, customer mix, capital intensity, and the timing of new-facility ramps. Announced capacity is not the same as qualified, high-yield production.
Layer 7: Networking Makes Thousands of Chips Work as One System
An AI cluster cannot deliver useful performance if accelerators spend too much time waiting for data or for one another. Switches, adapters, interconnects and optical components determine how efficiently the cluster scales. Fabrinet’s latest earnings and cash-flow picture show how rapidly AI and optical-connectivity demand is reaching the manufacturing layer—and how much inventory and capacity that growth can require.
Broadcom’s Q2 fiscal 2026 AI semiconductor revenue grew due to demand for both custom accelerators and AI networking, according to management. Arista’s Q2 2026 revenue rose 37.7% year over year to $3.036 billion, but the company did not disclose a standalone AI-revenue figure in that release. Treating all of Arista’s revenue as AI revenue would therefore be unsupported.
Networking investors should follow large-customer concentration, deployment timing, port speeds, bandwidth, product mix, and margins. Strong accelerator shipments may support demand, but architecture changes and spending by a small number of hyperscale customers can produce uneven quarters.
ABBO News Bottleneck Map: Where Economics Can Shift
The most attractive layer at one point in the cycle may not remain the most constrained layer. Investors can use the following signals to identify where pricing power and execution risk may be moving.
| Signal | Layer most directly affected | What investors should verify | What could invalidate the signal |
| Accelerator demand rises faster than complete-system shipments | HBM and advanced packaging | HBM qualification, packaging capacity, yields and lead times | Customer delays, product transitions or double ordering |
| Leading-edge wafer demand stays high while utilization is tight | Foundries and equipment | Node mix, yield, capex, tool orders and gross margin | Faster capacity additions or weaker end demand |
| AI clusters grow in processor count and geographic scale | Networking and interconnect | Networking revenue, bandwidth upgrades, optics demand and customer capex | More efficient architectures or slower data-center deployment |
| Custom accelerators proliferate across cloud providers | EDA/IP, foundries and custom-silicon suppliers | New design wins, tape-outs, backlog and customer concentration | Program cancellations or customers consolidating designs |
| Inventory rises while customers slow capital spending | Memory and equipment first, then other hardware layers | Inventory days, average selling prices, bookings and capex revisions | A rapid demand recovery or supply discipline |
This framework is a monitoring tool, not a prediction. A reported bottleneck can disappear quickly when customers change architecture, capacity ramps, or demand is delayed.
How to Compare AI Chip Stocks Without Mixing the Wrong Metrics
A sound comparison starts within the same layer.
- For accelerator designers: compare Data Center growth, gross margin, product cadence, software adoption, supply commitments, and customer concentration.
- For foundries: compare node mix, utilization, yield, capital intensity, depreciation, gross margin, and customer diversification.
- For equipment suppliers: compare bookings, backlog, installed base revenue, shipment timing, and customer capex.
- For memory suppliers: compare average selling prices, bit shipments, HBM mix, inventory, capex, and free cash flow across a full cycle.
- For EDA and IP companies: compare backlog or remaining performance obligations, recurring revenue, renewal activity, R&D intensity, and operating margin.
- For packaging providers: compare advanced-packaging capacity, qualification, utilization, customer mix and returns on new facilities.
- For networking vendors: compare data-center or AI-related demand where disclosed, port-speed transitions, margins and customer concentration.
Cross-layer comparisons require more care. Nvidia’s gross margin reflects design, systems, networking and software economics. TSMC’s margin reflects enormous fabrication and depreciation requirements. Micron’s earnings are highly sensitive to memory pricing. ASML’s results include new systems and installed-base services.
Investors should not infer market share by dividing one company’s revenue by another’s, annualize a single quarter without considering seasonality, or compare management-defined AI revenue with a broader Data Center segment as though they were identical.
Six Risks That Run Through the Entire AI Chip Stack
1. AI capital spending may not earn the expected return
Cloud providers and other large customers are committing substantial capital to AI infrastructure. If utilization, pricing, or end-user demand disappoints, those customers could slow future orders across accelerators, networking, memory, and equipment.
Alibaba’s $10.2 billion AI share sale is a current example of how infrastructure demand can transfer financing and dilution risk to shareholders.
2. A small number of customers can move several layers at once
Hyperscale customers buy accelerators, commission custom chips, reserve foundry capacity and deploy networking. A change in one customer’s architecture or spending plan can affect multiple suppliers simultaneously.
3. Export controls can strand inventory or limit addressable markets
Rules governing advanced chips and manufacturing equipment can change product configurations, licenses and geographic demand. Company guidance and SEC filings should be used instead of assuming that every announced product can be sold in every market.
4. Manufacturing remains geographically concentrated
Advanced semiconductor production, packaging and critical suppliers are concentrated in a limited number of locations. Natural disasters, geopolitical events, power constraints and logistics disruptions can affect the whole chain.
5. Technology transitions can shift value between layers
Custom accelerators, more efficient models, new memory architectures, optical interconnects and alternative packaging can change which component is scarce and which supplier has pricing power.
6. A strong business can still be an expensive stock
Revenue growth and competitive position do not determine the return from a stock without valuation. Investors should test assumptions for growth, margins, capital needs, and dilution rather than treating AI exposure as a substitute for price discipline.
What Retail Investors Should Track Each Quarter
Before buying or holding an AI semiconductor stock, ask five questions:
- Which exact layer generates the company’s AI exposure? Avoid relying on a broad label such as “AI stock.”
- Is the reported metric AI-only, Data Center, HPC, or management-defined? Record the definition before comparing periods.
- What is the current constraint? Look for evidence in lead times, utilization, yields, pricing, bookings, or qualification—not headlines alone.
- How capital-intensive is the growth? Separate companies that design products from those that must build factories or buy manufacturing tools.
- What would break the thesis? Identify the customer, product transition, regulation, supply ramp, or valuation assumption that matters most.
The exercise helps distinguish a durable business advantage from a temporary shortage.
Frequently Asked Questions
What is the AI chip stack?
The AI chip stack is the connected semiconductor value chain required to design, manufacture, and operate AI computing systems. It includes design software and IP, accelerators, foundries, manufacturing equipment, memory, advanced packaging, and networking.
Is Nvidia the only way to invest in AI chips?
No. Nvidia is a major accelerator, networking and platform supplier, but publicly traded companies also provide foundry capacity, semiconductor equipment, HBM, packaging, design software, IP and network infrastructure. Each layer has different economics and risks.
Why is HBM important for AI accelerators?
High-bandwidth memory moves data to and from processors at very high speed. Without enough memory bandwidth, expensive accelerators can spend more time waiting for data, reducing system efficiency.
Which metric best measures an AI semiconductor company?
There is no universal metric. The appropriate measure depends on the layer: Data Center revenue for some designers, node mix and utilization for foundries, bookings for equipment makers, memory pricing and bit shipments for memory suppliers, and backlog or renewals for EDA vendors.
The Bottom Line
The AI chip stack is not a single-company trade. It is a chain in which design tools create the blueprint, accelerators perform the computing, foundries manufacture the silicon, equipment enables capacity, HBM supplies data, packaging joins the components, and networking turns individual processors into a cluster.
Nvidia currently captures substantial platform economics, but its systems still depend on outside manufacturing, memory, and packaging. TSMC has powerful exposure to advanced computing, but it carries heavy capital requirements and geographic risk. Micron can benefit when memory is scarce, but memory pricing remains cyclical. Broadcom and Arista provide exposure to custom silicon and networking, while ASML, Cadence, Synopsys, and Amkor monetize less-visible parts of the chain.
For retail investors, the most useful question is not “Which company is the AI winner?” It is: Which layer is creating value now, how durable is that advantage, and what price is the market already charging for it?
Methodology: ABBO News used the latest company-reported results available through August 26, 2026. Fiscal periods and segment definitions differ by company; the exposure ratios above are therefore not market-share or valuation comparisons. The cited 2025 Forms 10-K are used only for audited business-model and supply-chain disclosures—not as performance comparisons with 2026 quarters. ABBO News calculations use reported amounts and may vary slightly because of rounding.
This article is for informational purposes and is not personalized investment advice.